Я покажу как можно создать диаграмму и гистограмму на C#, не пользуясь никакой библиотекой.
Для этого создадим две формы Form1 и DiagramCreator
На форме Form1 размещаем два текстовых поля, две кнопки и menuStrip и так же statusStrip и lable для информации как на рисунке ниже,:
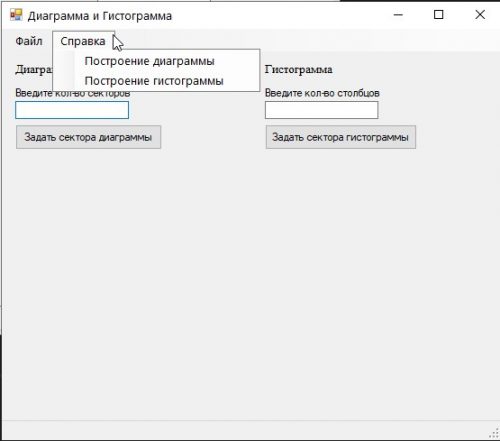
код формы будет выглядеть следующим образом:
using System;
using System.Collections.Generic;
using System.ComponentModel;
using System.Data;
using System.Drawing;
using System.Linq;
using System.Text;
using System.Windows.Forms;
using System.Collections;

namespace DiagramAndGistogram
{
    public partial class Form1 : Form
    {
        ArrayList diagrammaSectors = new ArrayList();
        ArrayList diagrammaColors = new ArrayList();
        ArrayList gistogrammaRectangles = new ArrayList();
        ArrayList gistogrammaColors = new ArrayList();
        public Form1()
        {
            InitializeComponent();
        }

        private void button1_Click(object sender, EventArgs e)
        {
            Graphics g = this.CreateGraphics();
            DiagramCreator dc = null;
            if (((Button)sender).Name == "button1")
            {
                if (textBox1.Text != "" && Convert.ToInt32(textBox1.Text) < 361)
                    dc = new DiagramCreator(Convert.ToInt32(textBox1.Text),"Диаграмма");
            }
            else
            {
                if (textBox2.Text != "")
                    dc = new DiagramCreator(Convert.ToInt32(textBox2.Text),"Гистограмма");
            }
            if (dc != null)
            {
                DialogResult r = dc.ShowDialog();
                if (r == DialogResult.OK)
                {
                    if (((Button)sender).Name == "button1")
                    {
                        int grad = 0;
                        for (int i = 0; i < dc.procents.Count; i++)
                        {
                            g.FillPie(new SolidBrush(((Color)dc.colors[i])), new Rectangle(0, 150, 200, 200), grad, ((int)dc.procents[i]));
                            diagrammaSectors.Add(((int)dc.procents[i]));
                            diagrammaColors.Add(((Color)dc.colors[i]));
                            grad += ((int)dc.procents[i]);
                        }
                    }
                    else
                    {
                        for (int i = 0, addW = 0; i < dc.procents.Count; i++, addW += 20)
                        {
                            if (i == 1)
                                addW -= 20;
                            g.FillRectangle(new SolidBrush(((Color)dc.colors[i])), new Rectangle(292 + addW, 400 - ((int)dc.procents[i]), 20, ((int)dc.procents[i])));
                            gistogrammaColors.Add(((Color)dc.colors[i]));
                            gistogrammaRectangles.Add(((int)dc.procents[i]));
                        }
                    }
                }
            }
        }

        private void построениеДиаграмыToolStripMenuItem_Click(object sender, EventArgs e)
        {
            MessageBox.Show("Диаграмма состоит из секторов, в суме градусы всех секторов должны быть 360, т.е. например 6 секторов по 60 градусов. Секторам задаются разные цвета для чёткого отображения.", "Информация о построение диаграмм");
        }

        private void построениеГистограммыToolStripMenuItem_Click(object sender, EventArgs e)
        {
            MessageBox.Show("Гистограмма отображает табличные данные при помощи графика из прямоугольников. Чаще всего ширина этих прямоугольников одинакава, а высота определяется передаваемым параметром. За дополнительной информацией обратитесь на сайт http://ru.wikipedia.org/wiki/Гистограмма", "Информация о построение гистограммы");
        }

        private void закрытьToolStripMenuItem_Click(object sender, EventArgs e)
        {
            Application.Exit();
        }

        private void Form1_Paint(object sender, PaintEventArgs e)
        {
            Graphics g = e.Graphics;
            if (gistogrammaColors.Count != 0)
            {
                for (int i = 0, addW = 0; i < gistogrammaRectangles.Count; i++, addW += 20)
                {
                    if (i == 1)
                        addW -= 20;
                    g.FillRectangle(new SolidBrush(((Color)gistogrammaColors[i])), new Rectangle(292 + addW, 400 - ((int)gistogrammaRectangles[i]), 20, ((int)gistogrammaRectangles[i])));
                }
            }
            if (diagrammaColors.Count != 0)
            {
                int grad = 0;
                for (int i = 0; i < diagrammaSectors.Count; i++)
                {
                    g.FillPie(new SolidBrush(((Color)diagrammaColors[i])), new Rectangle(0, 150, 200, 200), grad, ((int)diagrammaSectors[i]));
                    grad += ((int)diagrammaSectors[i]);
                }
            }
        }
    }
}
Перейдем ко второй форме DiagramCreator я приведу два блока в том числе и дизайна:
namespace DiagramAndGistogram
{
    partial class DiagramCreator
    {
        /// <summary>
        /// Required designer variable.
        /// </summary>
        private System.ComponentModel.IContainer components = null;

        /// <summary>
        /// Clean up any resources being used.
        /// </summary>
        /// <param name="disposing">true if managed resources should be disposed; otherwise, false.</param>
        protected override void Dispose(bool disposing)
        {
            if (disposing && (components != null))
            {
                components.Dispose();
            }
            base.Dispose(disposing);
        }

        #region Windows Form Designer generated code

        /// <summary>
        /// Required method for Designer support - do not modify
        /// the contents of this method with the code editor.
        /// </summary>
        private void InitializeComponent()
        {
            this.textBox1 = new System.Windows.Forms.TextBox();
            this.pictureBox1 = new System.Windows.Forms.PictureBox();
            this.button1 = new System.Windows.Forms.Button();
            this.button2 = new System.Windows.Forms.Button();
            this.panel1 = new System.Windows.Forms.Panel();
            ((System.ComponentModel.ISupportInitialize)(this.pictureBox1)).BeginInit();
            this.panel1.SuspendLayout();
            this.SuspendLayout();
            //
            // textBox1
            //
            this.textBox1.Location = new System.Drawing.Point(4, 8);
            this.textBox1.Name = "textBox1";
            this.textBox1.Size = new System.Drawing.Size(90, 20);
            this.textBox1.TabIndex = 0;
            //
            // pictureBox1
            //
            this.pictureBox1.BackColor = System.Drawing.Color.Green;
            this.pictureBox1.Location = new System.Drawing.Point(114, 8);
            this.pictureBox1.Name = "pictureBox1";
            this.pictureBox1.Size = new System.Drawing.Size(114, 20);
            this.pictureBox1.TabIndex = 1;
            this.pictureBox1.TabStop = false;
            this.pictureBox1.Click += new System.EventHandler(this.pictureBox1_Click);
            //
            // button1
            //
            this.button1.Location = new System.Drawing.Point(262, 15);
            this.button1.Name = "button1";
            this.button1.Size = new System.Drawing.Size(24, 129);
            this.button1.TabIndex = 2;
            this.button1.Text = "Создать";
            this.button1.UseVisualStyleBackColor = true;
            this.button1.Click += new System.EventHandler(this.button1_Click);
            //
            // button2
            //
            this.button2.Location = new System.Drawing.Point(262, 165);
            this.button2.Name = "button2";
            this.button2.Size = new System.Drawing.Size(24, 125);
            this.button2.TabIndex = 3;
            this.button2.Text = "Отмена";
            this.button2.UseVisualStyleBackColor = true;
            this.button2.Click += new System.EventHandler(this.button2_Click);
            //
            // panel1
            //
            this.panel1.AutoScroll = true;
            this.panel1.Controls.Add(this.textBox1);
            this.panel1.Controls.Add(this.pictureBox1);
            this.panel1.Location = new System.Drawing.Point(8, 7);
            this.panel1.Name = "panel1";
            this.panel1.Size = new System.Drawing.Size(248, 301);
            this.panel1.TabIndex = 4;
            //
            // DiagramCreator
            //
            this.AutoScaleDimensions = new System.Drawing.SizeF(6F, 13F);
            this.AutoScaleMode = System.Windows.Forms.AutoScaleMode.Font;
            this.AutoScroll = true;
            this.ClientSize = new System.Drawing.Size(298, 314);
            this.Controls.Add(this.panel1);
            this.Controls.Add(this.button2);
            this.Controls.Add(this.button1);
            this.Name = "DiagramCreator";
            this.Text = "DiagramCreator";
            this.Scroll += new System.Windows.Forms.ScrollEventHandler(this.DiagramCreator_Scroll);
            ((System.ComponentModel.ISupportInitialize)(this.pictureBox1)).EndInit();
            this.panel1.ResumeLayout(false);
            this.panel1.PerformLayout();
            this.ResumeLayout(false);

        }

        #endregion

        private System.Windows.Forms.TextBox textBox1;
        private System.Windows.Forms.PictureBox pictureBox1;
        private System.Windows.Forms.Button button1;
        private System.Windows.Forms.Button button2;
        private System.Windows.Forms.Panel panel1;
    }
}
using System;
using System.Collections.Generic;
using System.ComponentModel;
using System.Data;
using System.Drawing;
using System.Linq;
using System.Text;
using System.Windows.Forms;
using System.Collections;

namespace DiagramAndGistogram
{
    public partial class DiagramCreator : Form
    {
        int sectors;
        int x = 4, y = 8;
        int x2 = 114, y2 = 8;
        int ind = 2;
        public ArrayList colors = new ArrayList();
        public ArrayList procents = new ArrayList();
        string type = "";
        public DiagramCreator(int s, string t)
        {
            InitializeComponent();
            sectors = s;
            for (int i = 0; i < sectors ; i++, ind++)
            {
                TextBox temp = new TextBox();
                PictureBox temp2 = new PictureBox();
                temp.Name = "textBox" + ind.ToString();
                temp.Location = new System.Drawing.Point(x, y);
                temp.Size = new System.Drawing.Size(90, 20);
                temp2.Name = "pictureBox" + ind.ToString();
                temp2.Location = new System.Drawing.Point(x2, y2);
                temp2.Size = new System.Drawing.Size(114, 20);
                temp2.Click += new System.EventHandler(this.pictureBox1_Click);
                temp2.BackColor = Color.Green;
                panel1.Controls.Add(temp);
                panel1.Controls.Add(temp2);
                y += 35;
                y2 = y;
                type = t;
            }
        }

        private void pictureBox1_Click(object sender, EventArgs e)
        {
            ColorDialog c = new ColorDialog();
            DialogResult r = c.ShowDialog();
            if (r == DialogResult.OK)
                ((PictureBox)sender).BackColor = c.Color;
        }

        private void DiagramCreator_Scroll(object sender, ScrollEventArgs e)
        {
            Invalidate();
        }

        private void button1_Click(object sender, EventArgs e)
        {
            int tso = 0;
            foreach (Control c in panel1.Controls)
            {
                if(c is PictureBox)
                    colors.Add(((PictureBox)c).BackColor);
                try
                {
                    if (c is TextBox)
                    {
                        procents.Add(Convert.ToInt32(((TextBox)c).Text));
                        tso += Convert.ToInt32(((TextBox)c).Text);
                    }
                }
                catch
                {
                    procents.Add(0);
                }
            }
            DialogResult r = DialogResult.Yes;
            if (tso != 360 && type == "Диаграмма")
                r = MessageBox.Show("Сумма градусов секторов не верна, продолжить?","Предупреждение",MessageBoxButtons.YesNo);
            if(r==DialogResult.Yes)
                this.DialogResult = DialogResult.OK;
        }

        private void button2_Click(object sender, EventArgs e)
        {
            this.DialogResult = DialogResult.Cancel;
        }
    }
}
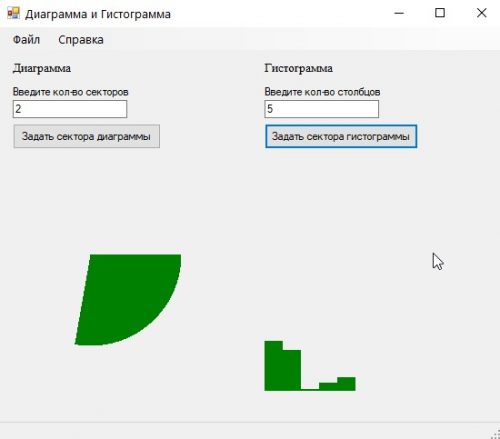
Итоговый результат работы приложения мы можем видеть ниже:
Как изменить тип диаграммы
Измените ChartType на один из следующих:
Pie— круговая диаграммаLine— линейнаяBar— горизонтальная гистограммаArea,Spline,Pointи др.
series.ChartType = SeriesChartType.Pie; // для круговой диаграммыПреимущества Chart
- Встроен в .NET Framework
- Гибко настраивается (цвета, легенды, подписи)
- Поддерживает экспорт изображений